
- June 17, 2026

-
-
Loading
Loading

Recently, the Florida House of Representatives launched the Taxpayer Accountability & Transparency Project with a website — www.FloridaTaxpayers.com — that ranks and grades Florida’s cities and counties based on spending, crime and education data. House Speaker José Oliva said the website “gives residents a useful tool to help them make educated judgments and hold their elected officials accountable.”
The project grew out of a legislative effort led by Representative Blaise Ingoglia, who argued that Floridians should be able to see how their city and county compare to others statewide. The bill passed the House in March but died in the Senate. House leadership decided to pursue the project on its own.
Cities and counties are graded and ranked based on six-year averages of per-capita spending and debt, average government salaries, full-time government employees per 100,000 residents, violent and property crime, local school grades from the annual Florida School Accountability Reports and graduation rates.
The Florida League of Cities and Florida Association of Counties opposed the project, arguing that budget, crime and education data are too simplistic and can give people a skewed view of how well a city or county is doing.
Of course, they are right, but having no data or comparison at all also skews people’s perspective of how well a city or county is doing.
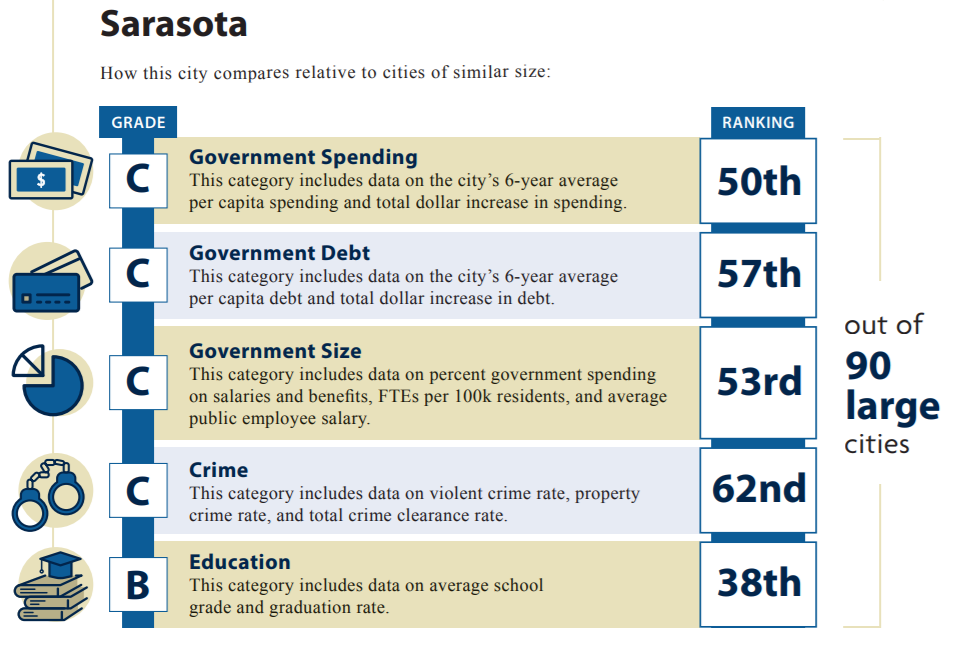
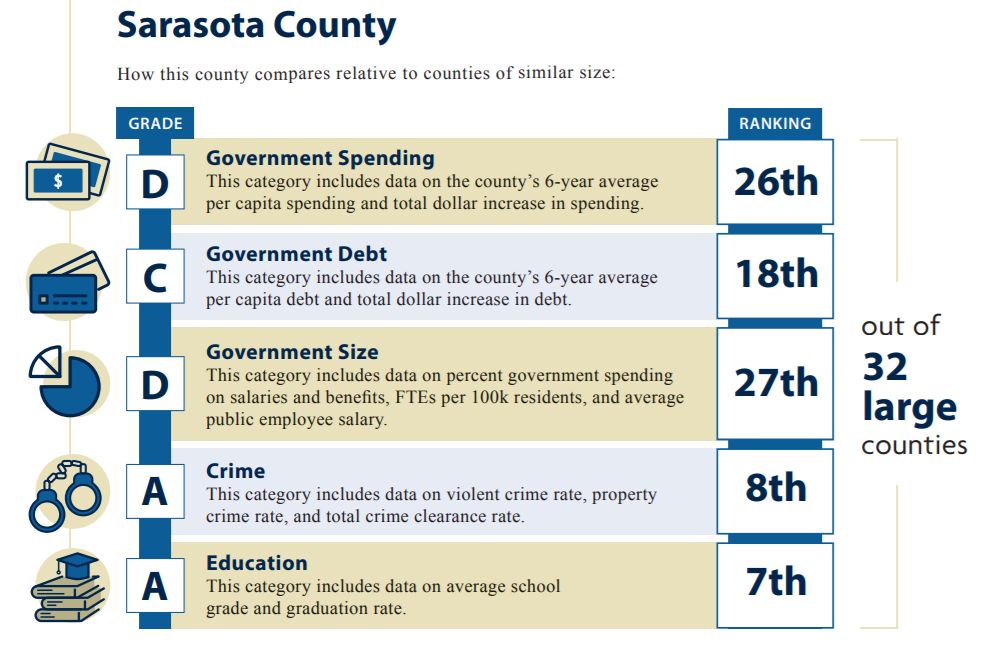
To their credit, FloridaTaxpayers.com provides all the raw data they use, so I, or anyone else, can do our own examination. I thought I would walk through what the data says about the city and county governments of Sarasota. For starters, you can see in the accompanying images the grades and ranks the project gave both jurisdictions.
I think the most accurate summation of their comparative performance is … middling.
Notice that both are compared only to the other jurisdictions of similar size statewide. And to their credit, unlike far too many Florida cities and counties, all of the data for the city and county of Sarasota were reported.
Maybe, by looking at the data and comparisons in more detail, we can see some ways Sarasota city and county government can improve. I will state some of the key data points for Sarasota city and county and how they compare to the highest and lowest jurisdiction but also how they compare to close “competitors,” St. Petersburg and Cape Coral for the city and Pinellas and Lee at the county level.
Highest salaries were in Weston at a whopping $175,460, while the lowest was Panama City at $41,827. St. Petersburg paid an average $59,127 and Cape Coral $68,217.
The most government employees per 100,000 residents was in Miami Beach at 2,573 while Weston had just 15. St. Petersburg had 1,269 and Cape Coral 857.
Plant City spent 97% of its budget on salary and benefits, the highest in the state, while Weston was at 2%. In St. Petersburg it was 37% and Cape Coral 45%.
Maybe not surprisingly, Miami-Dade had the highest salaries at $79,792; meanwhile our neighbors in Manatee had the lowest at $29,007. Pinellas and Lee salaries were $65,363 and $56,993, respectively.
Monroe had the most employees per 100,000 residents at 1807 and Santa Rosa the lowest at 252, while Pinellas had 546 and Lee 407.
The highest percentage of budget for staff costs was Union at 67% and the lowest Broward at 15%. Pinellas spent 30% and Lee 18%.
Highest total crime per 100,000 residents was in Leon at 4,456 and lowest in Santa Rosa at 1,117. Most violent crimes were in Alachua at 688 and lowest in Santa Rosa at 149, and highest clearance rate was in Bay at 66% and lowest in Miami-Dade at 17%. Pinellas had 2,962 average total crimes with 365 violent and a clearance rate of 26%. Lee’s total average crime was 1,811 with 298 violent and a clearance rate of 26%.
That was a lot of data and comparisons, and it shows a lot of variation. What are we to make of it?
Although circumstances can be different in different cities or counties, no city or county in Florida is in an entirely different world than the others. Things that work in one of them can work in others as well. This is even more true comparing with our neighboring beach cities and counties.
The idea is to see what might be possible, what stretch goals the city and county might set. Cape Coral has three times the population of Sarasota yet spends much less and has fewer employees while having lower crime and good schools. And it is a genuinely nice town, just like Sarasota.
Meanwhile, Lee County spends less and has much less debt than Sarasota County while having similar staffing levels and somewhat lower crime, though its schools do not perform as well.
What might the governments of the city and county of Sarasota learn by looking at the practices and policies of those that have higher grades in this report? Perhaps a lot. That kind of exchange of best practices could help every city and county government improve its performance.
Dr. Adrian Moore is vice president at Reason Foundation and lives in Sarasota.


